Configure VS Code for ROS 2
This tutorial provides a comprehensive guide to configuring Visual Studio Code (VS Code) for effective ROS 2 development. It covers essential setup steps including debugging C++ nodes with GDB, optimizing build processes using colcon’s symlink-install, and automating common workflows through VS Code’s tasks.json. Additionally, it explores the features of the official ROS 2 extension to further streamline your development environment. By following these best practices, developers can significantly improve their productivity and more easily identify runtime errors in their robotic systems.
This tutorial assumes you already have ROS 2 and Visual Studio Code installed and properly set up on your system.
In this tutorial, we’ll walk through setting up a development environment in Visual Studio Code (VS Code) to debug and compile ROS 2 packages effectively. We’ll start with configuring debugging tools to help identify runtime errors and then explore how to streamline your build process using VS Code’s task configurations.
Debugging in VS Code
Let’s begin with debugging.
Open VS Code and load a ROS 2 package. For this example, we’ll be using a simple publisher node written in C++. We’ll start by intentionally commenting out the line that creates the publisher to simulate a bug. Even though the code appears fine to C++ linting tools, compiling it with colcon build will complete successfully.
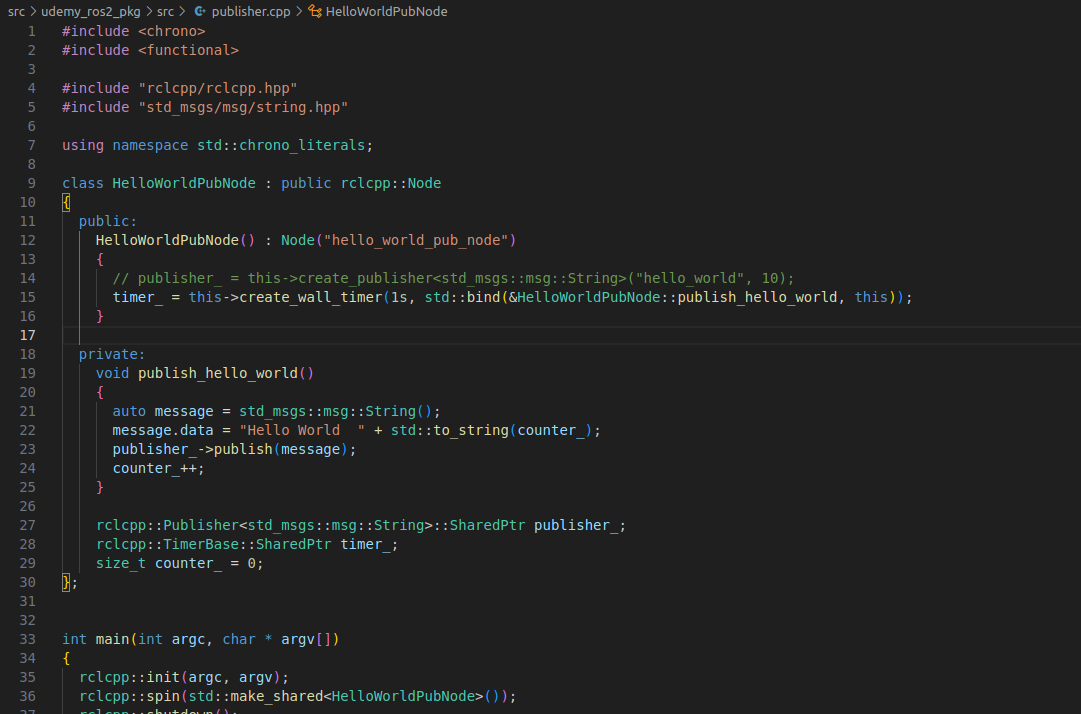
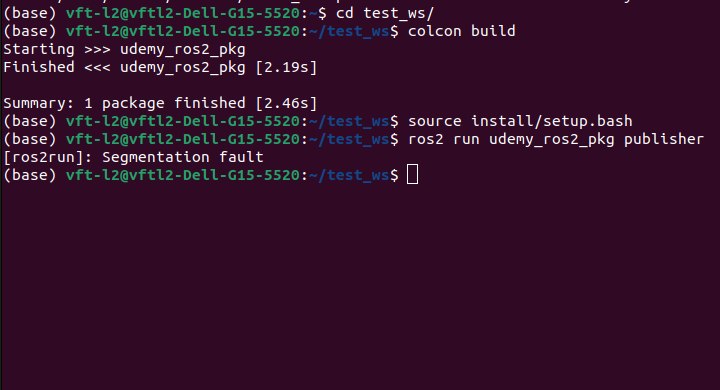
However, when you try to run the node, you’ll get a segmentation fault. This error isn’t informative, so we’ll set up proper debugging using gdb and VS Code.
Using GDB
First, build your ROS 2 workspace with debugging symbols:
colcon build --cmake-args -DCMAKE_BUILD_TYPE=Debug
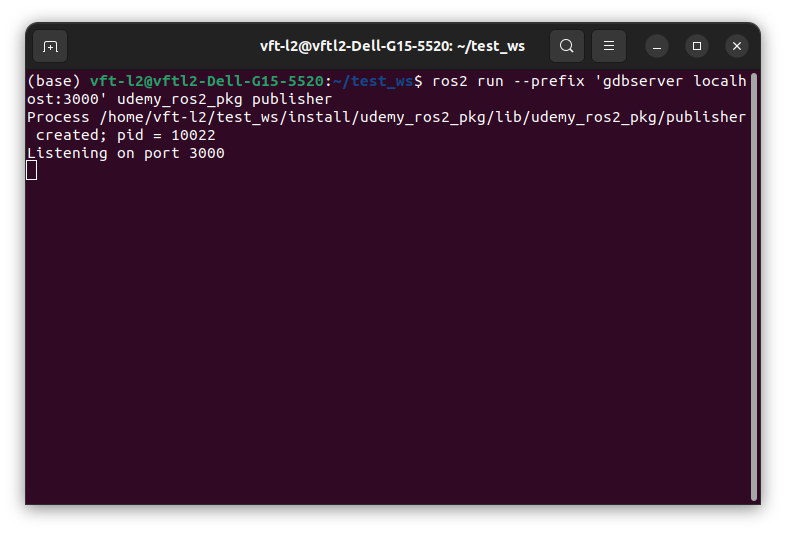
Then, run the node using gdbserver:
ros2 run --prefix 'gdbserver localhost:3000' <your_package> <your_node>
If gdbserver is not installed, you can install it with:
sudo apt update
sudo apt install gdbserver
So here we see processing our node listening on Port 3000, but now we need to configure our Vs code
to communicate with the debugger.
Now, configure VS Code to connect to the gdbserver. Create a .vscode/launch.json file:
{
  "version": "0.2.0",
  "configurations": [
    {
      "name": "Attach to gdbserver",
      "type": "cppdbg",
      "request": "launch",
      "miDebuggerServerAddress": "localhost:3000",
      "program": "/path/to/install/<your_package>/lib/<your_package>/<your_node>",
      "cwd": "${workspaceFolder}",
      "MIMode": "gdb",
      "externalConsole": false,
      "stopAtEntry": false
    }
  ]
}
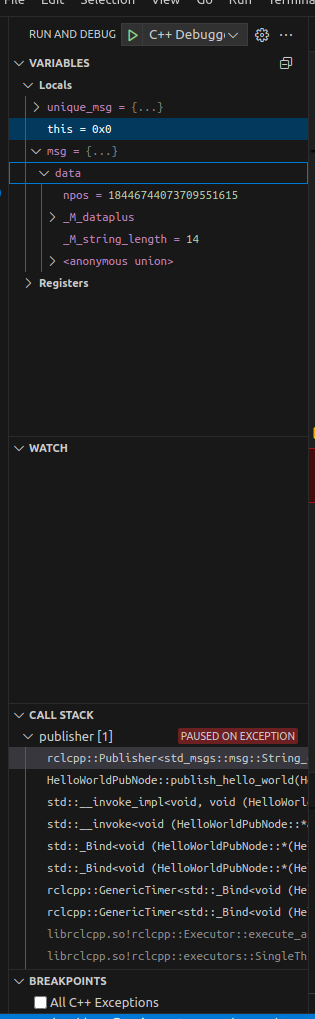
Once saved, go to the Debug tab in VS Code and click Start Debugging. The debug pane shows variables, their values, and the call stack—helping identify issues such as an uninitialized publisher.
Simlink Install with colcon
By default, when you run colcon build, the build system copies the compiled binaries, libraries, and resources into the install/ directory. While this works fine, it can be inefficient and slow—especially during iterative development—because every time you rebuild, files are duplicated into the install space.
To improve build efficiency, use the --symlink-install flag with colcon. This creates symbolic links instead of copying files into the install/ directory:
colcon build --symlink-install
If you’ve already built the workspace, delete build/, install/, and log/ directories first:
rm -rf build/ install/ log/
Then rerun the build command with the symlink flag.
Automating Builds and Debugging with tasks.json
Now, it can be inconvenient to remember and re-type long commands like colcon build --symlink-install, especially if you often switch between workspaces. VS Code allows us to automate such tasks using a tasks.json file.
Creating a Build Task
Open your workspace in VS Code. In the file explorer, navigate to the .vscode/ directory. If it doesn’t exist, create it. Inside that directory, create a file named tasks.json.
Here’s an example configuration:
{
  "version": "2.0.0",
  "tasks": [
    {
      "label": "build",
      "type": "shell",
      "command": "source /opt/ros/humble/setup.bash && colcon build --symlink-install",
      "group": {
        "kind": "build",
        "isDefault": true
      },
      "problemMatcher": []
    },
    {
      "label": "build (debug)",
      "type": "shell",
      "command": "source /opt/ros/humble/setup.bash && colcon build --cmake-args -DCMAKE_BUILD_TYPE=Debug",
      "group": "build",
      "problemMatcher": []
    },
    {
      "label": "debug-helper",
      "type": "shell",
      "command": "echo "\nRun your node with:\nros2 run --prefix 'gdbserver localhost:3000' <your_package> <your_node>\n\nThen update launch.json to point to the right executable."",
      "group": "build",
      "problemMatcher": []
    }
  ]
}
Tip: If you want to source your full
.bashrcinstead of just ROS setup, modify thecommandline:source ~/.bashrc && colcon build --symlink-install
To run these tasks:
- Go to Terminal → Run Build Task or press Ctrl+Shift+B.
- Choose
build,build (debug), ordebug-helper.
This automates builds and reminds you of necessary debug setup steps.
Important: Make sure VS Code is opened in your ROS 2 workspace root. If you’re in the wrong directory,
colcon buildmay fail or build the wrong packages.
Using the ROS 2 VS Code Extension
The ROS Tools extension in VS Code offers convenient tools for interacting with ROS 2.
Common ROS Commands in VS Code
Press F1 and type ROS to view available commands:
- ROS: Show Status – Displays current ROS nodes, topics, and status.
- ROS: Create ROS Terminal – Opens a terminal with the correct ROS environment sourced.
- ROS: Run a ROS Executable – Lets you select a package and node to run from a dropdown.
- ROS: Update C++ Properties – Updates your
c_cpp_properties.jsonfile to enable IntelliSense in C++ ROS projects. - ROS: Install ROS Dependencies (rosdep) – Installs missing dependencies in your workspace using
rosdep install.
Even if you’re using ROS 2 (e.g., Humble), some commands still reference
rosrunfrom ROS 1. These labels are legacy but still work for launching executables.
Running a Node via Extension
- Press F1 →
ROS: Run a ROS Executable. - Choose your package.
- Select the executable (e.g.,
minimal_publisher). - If needed, enter arguments.
- A terminal will open and run the node with the correct environment.
Creating a ROS-Sourced Terminal
Select ROS: Create ROS Terminal from the F1 menu. This opens a new terminal tab with ROS environment variables sourced, allowing you to run commands like:
ros2 topic echo /your_topic
Updating C++ IntelliSense
If your C++ symbols or headers aren’t resolving correctly, use:
ROS: Update C++ Properties
This command re-generates c_cpp_properties.json with include paths specific to your workspace and ROS installation.
Troubleshooting and Best Practices
- Always open VS Code in your workspace root directory.
- Use
--symlink-installto reduce rebuild times. - Use
launch.jsonto attach VS Code’s debugger to ROS nodes. - Keep reusable scripts or environment helpers in your workspace for consistency.
Summary
In summary, setting up a robust development environment in VS Code is crucial for efficient ROS 2 development. By using GDB for debugging, symlink-install for faster builds, and automating tasks with tasks.json, you can create a more responsive and error-resistant workflow. The ROS 2 extension further enhances this by providing integrated tools for common ROS operations.